


Smart recovery in the later part of the session helped the benchmark indices close higher for the ninth straight session on April 13, backed majorly by banking and financial services stocks.
The Bank Nifty itself clocked 1.38 percent or 575 points gain to close at 42,133, while the BSE Sensex added 38 points to 60,431.
The Nifty50 recovered around 100 points from day's low and closed with 16 points gains at 17,828, forming small bodied bullish candlestick pattern on the daily scale with making higher tops higher bottoms for ninth consecutive session.
The broader markets also ended with moderate gains, with the Nifty Midcap 100 and Smallcap 100 indices rising 0.2 percent and 0.3 percent gains respectively.
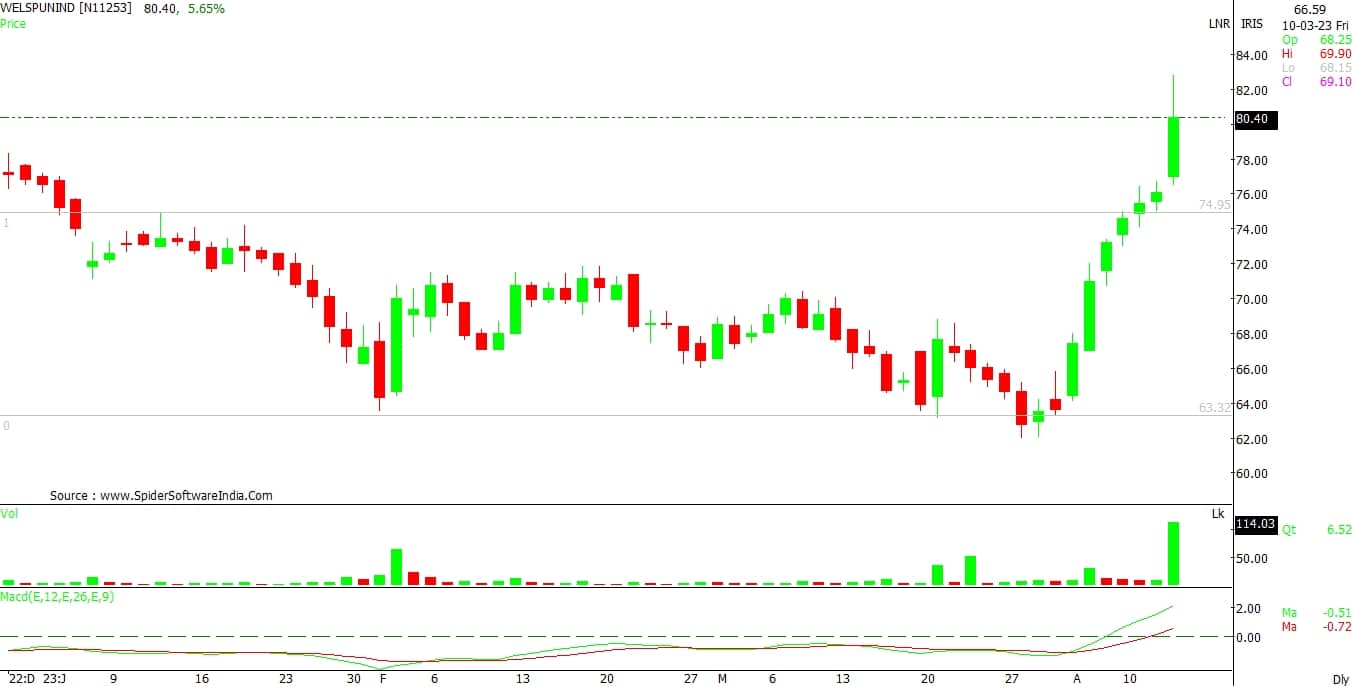
Stocks that performed better than broader markets included Welspun India which jumped 6.6 percent to Rs 81 and formed a long, bullish candlestick pattern on the daily timeframe, making higher-highs-higher-lows for the eighth straight session. With the sharp rally, the stock climbed above all key moving averages (21, 50, 100 and 200-day EMA - exponential moving average).
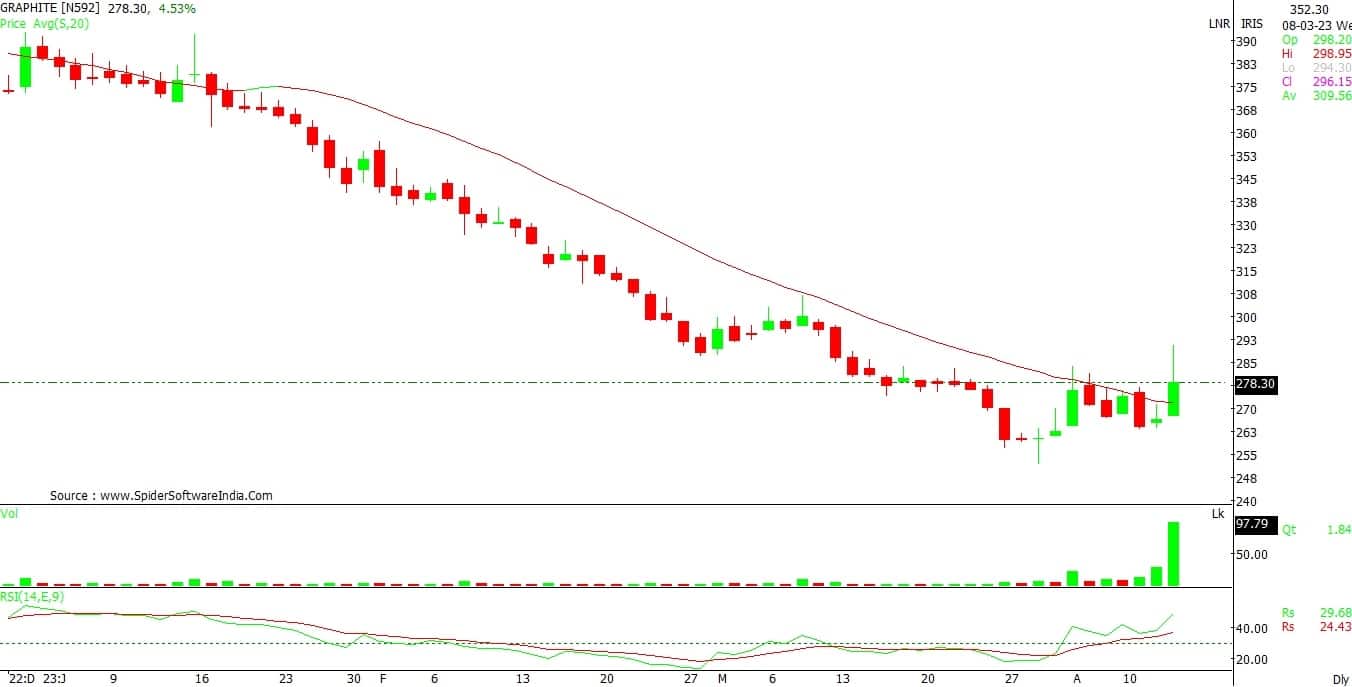
Graphite India shares gained 4.6 percent to close at Rs 278 and formed bullish candle on the daily charts with significantly higher volumes. The stock has seen a breakout of horizontal resistance trendline adjoining highs of March 24, April 6 and April 11.
Eicher Motors jumped 2.7 percent to Rs 3,213 and formed bullish candlestick pattern on the daily timeframe for third straight session, which resembles Three White Soldiers kind of pattern. With this rally, the stock got back above all key moving averages, with increasing volumes.
Here's what Shrikant Chouhan of Kotak Securities recommends investors should do with these stocks when the market resumes trading today:On the daily scale, the stock is trading into a rising channel chart formation making the higher top and higher bottom constantly. As a result, all major technical trend indicators such as MACD (moving average convergence divergence) and ADX (average directional index) are strong and steady.
Therefore, upward movement from the current level is very likely to continue in the coming horizon. Unless it is trading below Rs 3,100, positional traders can retain an optimistic stance and look for a target of Rs 3,450.

On a broader timeframe, the stock had been in a prolonged downtrend. Therefore, it is currently into an oversold territory and reversed from its demand area.
The texture of the chart formation and technical indicator RSI (relative strength index) is indicating the current reversal formation could lead to a new leg of the uptrend from its demand zone.
In the near term, Rs 267 would be the immediate support zone for the stock. Above the same, the upward rally could continue towards Rs 300 level.
The stock is trading into a rising channel pattern after reversal from the lower levels and forming the higher lows series continuously on the daily scale. The strong bullish momentum suggest that the counter is likely to maintain bullish continuation chart formation in the coming horizon.
For traders, Rs 77 would act as an important support zone while Rs 86 could be the key resistance area for the short-term traders. However, below Rs 75 level the uptrend would be vulnerable.
Discover the latest Business News, Sensex, and Nifty updates. Obtain Personal Finance insights, tax queries, and expert opinions on Moneycontrol or download the Moneycontrol App to stay updated!
Find the best of Al News in one place, specially curated for you every weekend.
Stay on top of the latest tech trends and biggest startup news.


